ETH/USD Market Converges to the Bottom at $4,000
Market Converges to the Bottom at $4,000 – November 27
There have been variant lines of trading activity in the ETH/USD trade operations as the crypto market converges to the bottom at $4,000 over a couple of sessions. The crypto’s price, as of writing, bags a volume of about $4,104, trading at about 1.44 percentage rates in positives. That gives an insight that the market may soon experience a rebound in its motions.
Market Converges to the Bottom at $4,000: ETH Market
Key Levels:
Resistance levels: $4,500, $4,750, $5,000
Support levels: $3,750, $3,500, $3,250
ETH/USD – Daily Chart
The ETH/USD daily chart reveals that the crypto-economic market converges to the bottom at $4,000 level as there have even been some occasions that a line of false-short breakdowns made. The 14-day SMA trend line is above the 50-day SMA trend line. The bullish trend line drew to locate a psychological trading level that price needed to breach fearfully southward to cause an ugly trading moment to the upside. Nevertheless, the bigger SMA indicator has been positioned beneath it to serve as the better supportive trading tool between $4,000 and $3,500. The Stochastic Oscillators have traveled from the oversold region, reaching the range of 40. And they now attempt to close the lines around it. That signifies that the market may feature for some more times around its present area of trading convergences.
What can be the next price direction as the ETH/USD market converges to the bottom at $4,000?
The trading levels between $4,000 and $3,500 may still be instrumental in observing the ETH/USD price next direction as the market converges to the bottom at the value-line formerly mentioned. In the wake of that presumed scenario playing out, buyers are to be on the alert as to when there will be room for active rebounding motion to make decent long entry positions afterward.
On the downside of the technical analysis write-up, the ETH/USD market sellers have to heighten efforts around $4,000 to break down the barrier seemingly piling up beneath the point mentioned. An eventual loss of momentums on the part of intending sellers at the trading capacity level will portend an early return of the market to its upward trend motion. All in all, the traders should be cautious of their entries, especially if the market chooses to result in a recess trading situation.
ETH/BTC Price Analysis
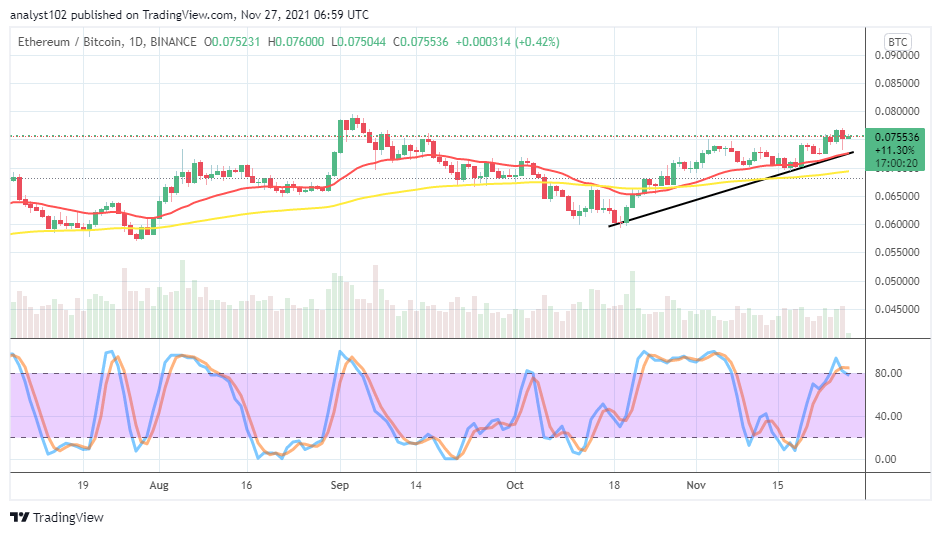
In comparison, the daily price analysis chart exhibits that Ethereum still gets lead over the trending catalyst existing between it and Bitcoin. The cryptocurrency pair market converges at a higher level above the trend lines of the SMAs. The 14-day SMA indicator is above the 50-day SMA indicator. The bullish trend line drew to conjoin with the smaller SMA at the tail end to strengthen it. The Stochastic Oscillators are in the overbought region, trying to close the lines at the range of 80. That indicates that the base crypto may shift stance negatively in the business operations involving the flagship crypto-coin in the near time.
Looking to buy or trade Bitcoin (BTC) now? Invest at eToro!
68% of retail investor accounts lose money when trading CFDs with this provider.

Read more:
Credit: Source link


Comments are closed.