BCH/USD Price Lowers in Ranges
BCH/USD Price Lowers in Ranges – November 29
The BCH/USD market price lowers in ranges of between $700 and $500 lines. The crypto market is now witnessing a trade volume of about $576 at a percentage rate of around 1.29 positive. It shows presently that the crypto’s price is making an effort to recover its catalyst as it trades against the US Dollar valuation.
Price Lowers in Ranges: BCH Market
Key Levels:
Resistance levels: $700, $800, $900
Support levels: $500, $450, $400
BCH/USD – Daily Chart
The BCH/USD daily trading chart showcase that the crypto economic market price lowers in ranges marked at $700 and $500 levels. The market now sees variant smaller candlesticks emerging between the $600 mid-range point and the lower value-range level. There have been some signs, portending a suitable condition for an upside move closely beneath the mid-range level. The Stochastic Oscillators have initially crossed the lines southbound against the range of 40. And, they now appear crossing the lines back to the northbound a bit above the range of 20. That suggests that some degrees of upward momentums are in the offing.
At what point will the BCH/USD change its current trending style as the market price lowers in ranges?
The time to have a clear cut of the BCH/USD market changing direction will depend on the result of the major market movers’ reaction as price lowers in ranges continually for the time being. In the meantime, long-position takers may have to abide by the principles guiding the range-bound trading manner. That is they would have to look out for when price likely to rally from the lower range level to consider launching a buy order.
Similarly, on the downside of the technical analysis, the BCH/USD will have to patiently wait for the price to get rejected at the upper range level to get a decent sell entry before exerting a position. Executing further orders at the mid-range level isn’t technically ideal, especially while there is no active movement in the crypto-economic business activity. Traders should also be wary of late entry to pursue the market in the direction of a sudden breakout or down.
BCH/BTC Price Analysis
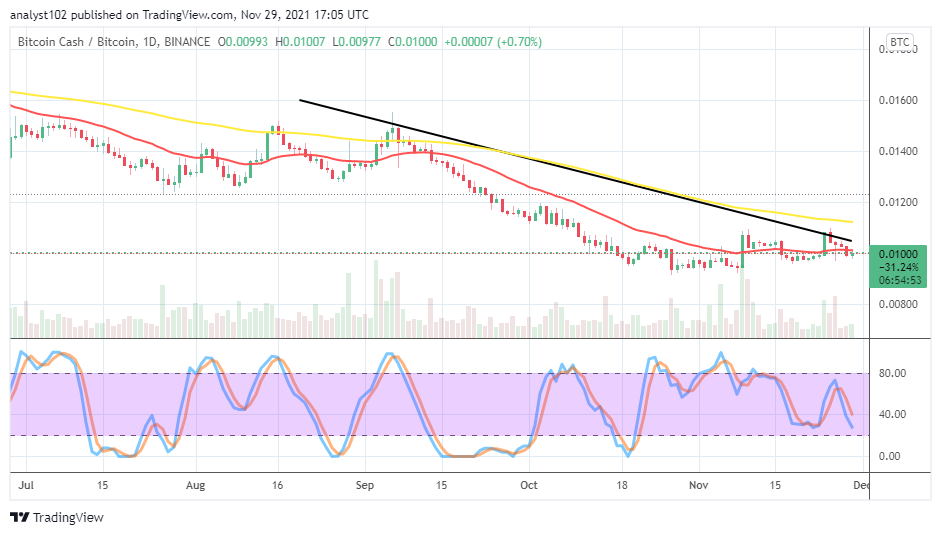
In comparison, Bitcoin Cash’s pushing catalyst falls under pressure as traded against Bitcoin. The cryptocurrency pair market price lowers southward around the trend line of the smaller SMA. The 50-day SMA indicator is over the 14-day SMA. The Stochastic Oscillators, slightly against the range of 40, point southbound. That indicates that the base crypto may still decline in strength as paired with the counter crypto trading strength in the near time.
Looking to buy or trade Bitcoin (BTC) now? Invest at eToro!

68% of retail investor accounts lose money when trading CFDs with this provider.
Read more:
Credit: Source link


Comments are closed.