Bitcoin HODLers End 2023 With Belief, Set New Record
On-chain data shows the Bitcoin long-term holders have ended 2023 with strong belief as their supply has blasted past the all-time high.
Bitcoin Long-Term Holders End 2023 On Strong Accumulation
As pointed out by CryptoQuant Netherlands community manager Maartunn in a new post on X, the BTC long-term holders have ended 2023 by repeatedly setting new all-time highs (ATHs).
There are many ways the investors can be grouped based on on-chain data, with one popular method being through holding time. The Bitcoin market is broadly divided into two cohorts using this criteria: the “short-term holders” and “long-term holders.”
The cutoff of 155 days is used for separating the two groups. Any address holding its coins for less than this period is put inside the STH cohort, while the rest of the holders belong to the LTH group.
Statistically, the longer an investor keeps their coins still, the less likely they become to sell or move them on the blockchain. As such, the LTHs make up for the more stubborn side of the sector.
While the STHs are fickle-minded and panic-sell whenever there is some movement in the wider market, the LTHs tend to stay silent through crashes and rallies alike.
The times that these diamond hands do sell can be ones to watch for, however. One way to track the movements of the LTH group is through the combined supply its members are holding in their wallets currently.
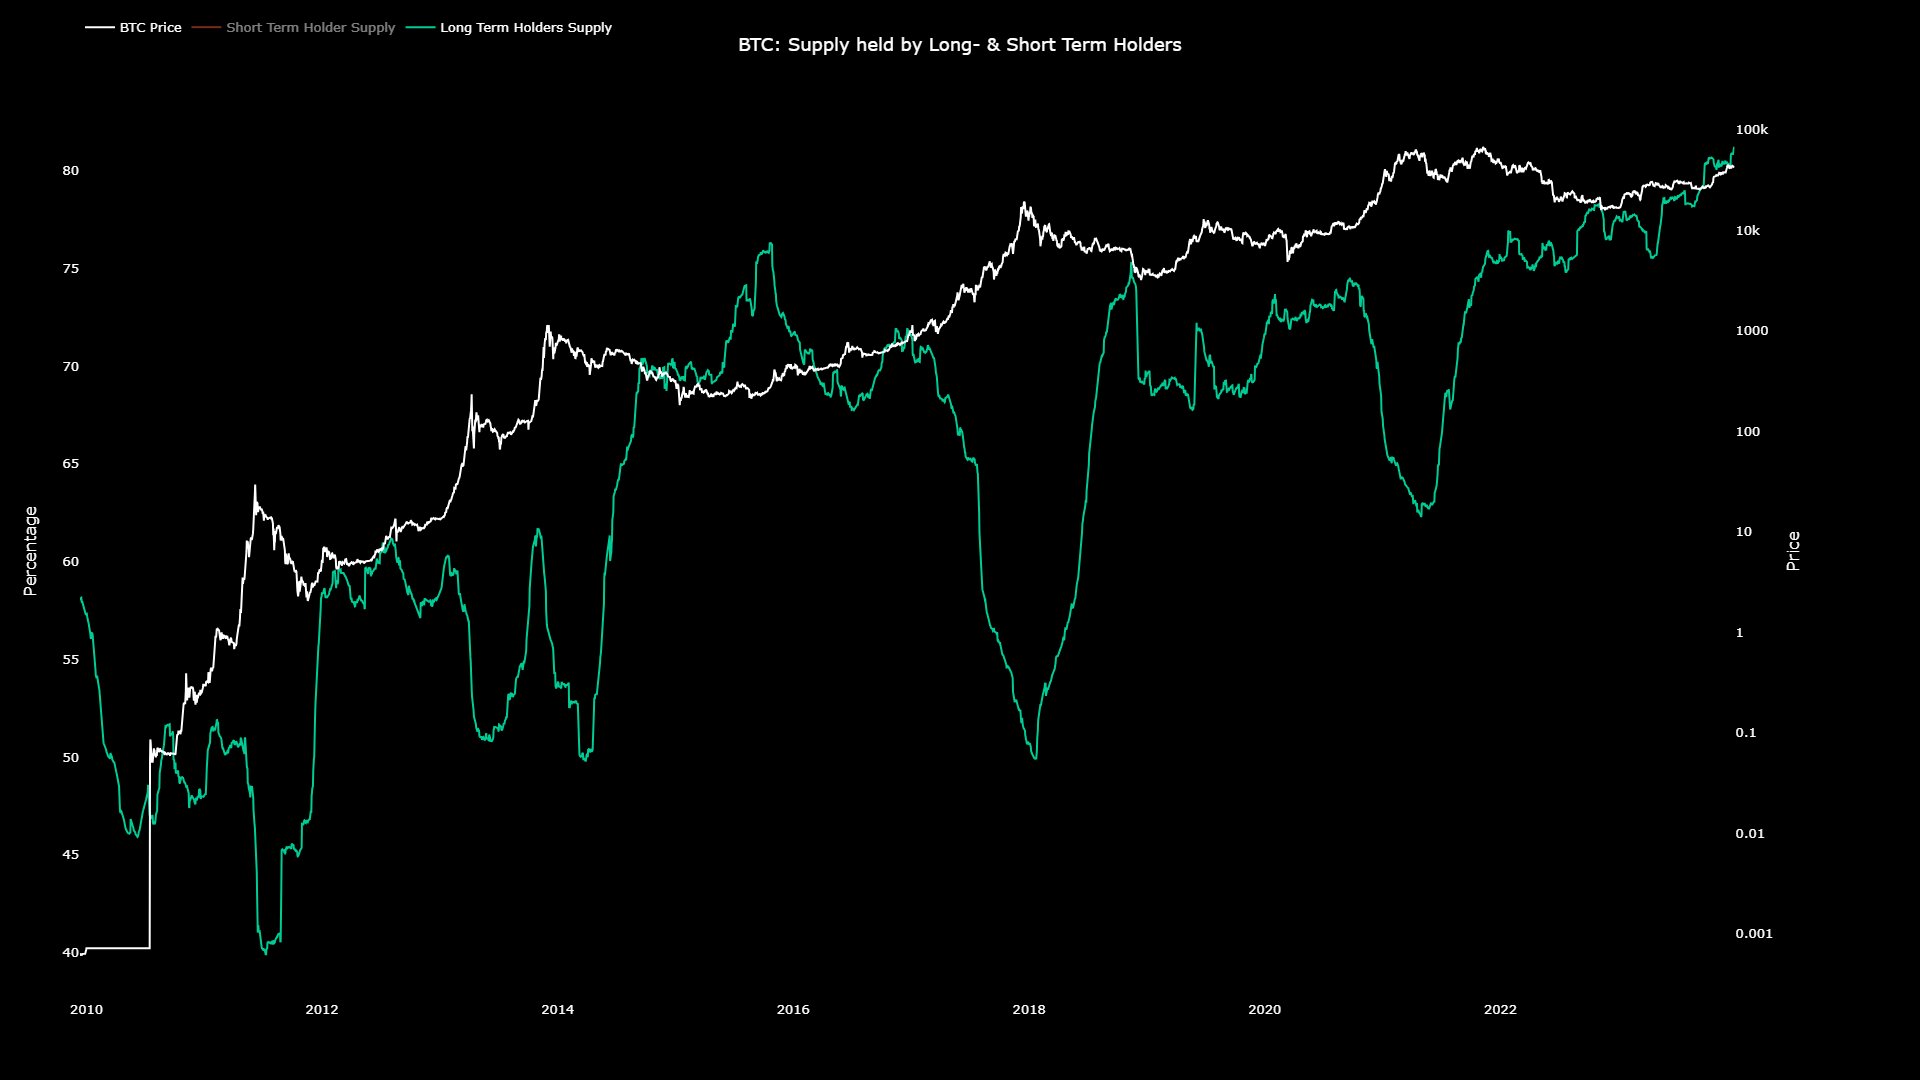
Here is a chart that shows the trend in this Bitcoin indicator throughout the cryptocurrency’s history:
The value of the metric appears to have been sharply going up in recent weeks | Source: @JA_Maartun on X
The above graph shows that the Bitcoin LTH supply saw an overall uptrend in 2023. The rise in the percentage of the total circulating supply held by these HODLers was especially sharp at the end of the year, as it set consecutive new ATHs.
Following the latest spike, the LTHs are nearing control of 80% of the supply. Such a large part of the supply being locked in the wallets of these diamond hands is naturally a positive sign for the asset’s long-term outlook.
Something to keep in mind, though, is the fact that this indicator has a 155-day delay attached to it. Any rises in it don’t suggest that buying is happening now, but rather that it happened 155 days ago, and those coins have successfully matured into the cohort.
There is no such delay attached to selling, though, as coins instantly leave the group when they are transferred on the network. The chart shows that the LTHs have historically participated in significant selling when bull rallies heat up as they harvest their bear-market accumulation profits.
Based on this pattern, any substantial declines in the metric’s value could be ones to keep an eye on, as they may signal such a beginning of heated bullish momentum for Bitcoin.
BTC Price
Bitcoin has gone stale recently, as its price still trades around the $42,700.
Looks like the asset has been moving sideways recently | Source: BTCUSD on TradingView
Featured image from Kanchanara on Unsplash.com, charts from TradingView.com, CryptoQuant.com
Credit: Source link


Comments are closed.