BCH/USD Market Concurrently Holds at $600
BCH/USD Market Continually Holds at $600 level – October 25
The BCH/USD market concurrently holds at $600 level with lighter promising buy signs a bit over the value line. The crypto-economic price trades around $627 at a percentage rate of about 1.82 positives.
Market Continually Holds at $600 level: BCH Market
Key Levels:
Resistance levels: $700, $900, $1,100
Support levels: $500, $400, $300
The BCH/USD daily chart showcases that the crypto-economic market concurrently holds at $600 level. The 14-day SMA trend line has moved upward to conjoin with the 50-day SMA trend line at a higher line around the value line. The bullish trend line drew, indicating that the market still somewhat enjoys a bullish threshold outlook. The stochastic Oscillators have traveled southbound to touch the range of 40. And, they now close the lines around it. It still appears that not much difference is expected in the present trading situation of the market.
Should traders remain unbiased in their trading approaches as the BCH/USD market concurrently holds at $600 level ?
Traders may have to remain unbiased in their trading approaches as the BCH/USD market concurrently holds at $600 level over a couple of sessions until the present. It shows that a flat trading direction has been maintained in the crypto business operations, giving rise to indecision conditions. However, trading opportunities are more visible on lower time frames. A well-articulated pattern needed to observe even on lower time-frames to get buy entries at a lower-trading spot.
On the downside, a similar trading approach has to apply by the BCH/USD market sellers. That means that they will have to watch out for a price rejection motion on a lower time frame. While that comes to the past, any possible active reversal may give way to a sell entry. But, a violent shoot-up against the resistance level at $700 will signify a full-fledged return of a bullish trend. Therefore, the seller needed to be wary of that scenario suddenly
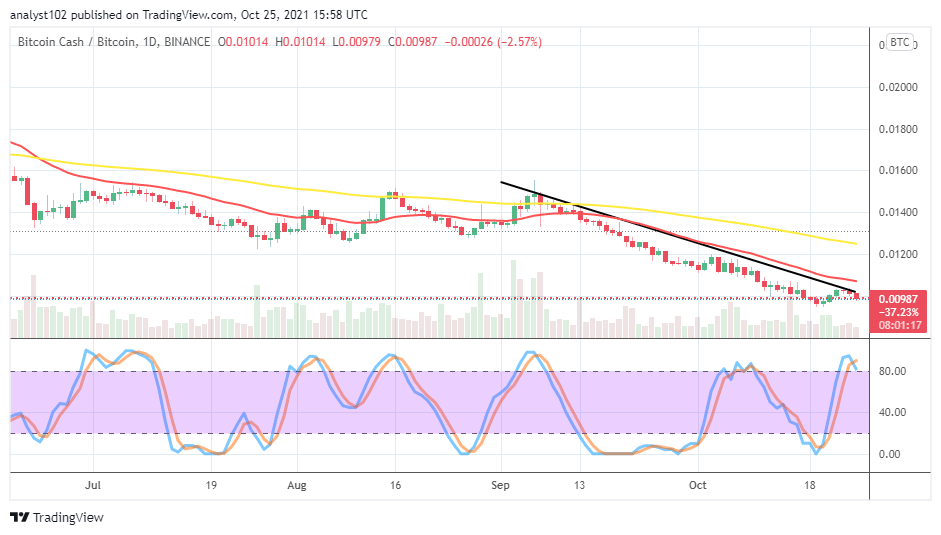
BCH/BTC Price Analysis
In comparison, Bitcoin Cash’s trending ability still lacks the energy to push against Bitcoin. The cryptocurrency pair market concurrently holds below the SMA indicators. There is a visible space separating the indicators as the 50-day SMA trend line is above the 14-day SMA trend line. The Stochastic Oscillators are in the overbought region, slightly crossing the lines to the south. That indicates that the base crypto may still go under as paired with the most valuable crypto.
Looking to buy or trade Bitcoin Cash (BCH) now? Invest at eToro!

68% of retail investor accounts lose money when trading CFDs with this provider.
Read more:
Credit: Source link


Comments are closed.